Keeping vLLM Fast Under CPU Pressure: A sched_ext Scheduler for GPU Inference
As open-source LLMs advance rapidly, more and more people are choosing to deploy these models locally, running them on Mac Mini (Studio), NVIDIA DGX, or other high-performance hardware. But as models grow larger, how to effectively boost inference speed and reduce resource consumption has become a key focus. This post is about a scheduling angle that is often overlooked.
Why does CPU pressure show up in production?
Many people assume “LLM inference is the GPU’s job, and the CPU is just a helper.” But once you actually put vLLM into production, you find it isn’t that simple. In practice, an inference node rarely runs a single clean vLLM process. Common situations include:
- Co-location: To squeeze every drop out of an expensive GPU node, the same machine often hosts other batch jobs, data preprocessing, log/metrics agents, and even other services besides vLLM. All of these processes are fighting for the same set of CPU cores.
- K8s infrastructure eats CPU too: Daemons like
containerd,kubelet, the CNI (calico), and the device plugin compete for CPU with your workload when the node is under pressure. Once they get starved, cascading problems follow — health-probe timeouts, pods being restarted, and so on. - vLLM itself is CPU-dependent: Don’t forget that tokenization, HTTP/streaming, the
EngineCorethat schedules and submits CUDA kernels, and GPU interrupt handling (IRQ handlers) all run on the CPU. When the CPU is stolen by a noisy neighbor, even the fastest GPU can only sit idle, waiting for the CPU to feed it the next batch of work.
We measured this on a DGX Spark (GB10): under a CPU-heavy scenario like stress-ng --cpu 16, vLLM’s decode throughput can drop by more than 50%, with jitter (std) as high as 50%. This isn’t because the GPU isn’t powerful enough; it’s because CPU scheduling failed to protect the latency-critical work (GPU IRQ, EngineCore), which got diluted by background noise.
What is Gthulhu, and why introduce it?
The Linux default scheduler (CFS / EEVDF) is built around fairness — it tries to give every task an even slice of CPU time. But for an LLM inference workload, we don’t want fairness; we want the right task to get the CPU at the right time: GPU interrupt handling and vLLM’s hot path must take priority, while stress tools and background batch jobs should yield. The default scheduler has no way to express this kind of “tiered priority” intent.
This is exactly the problem Gthulhu sets out to solve. Gthulhu is a scheduler built on Linux sched_ext (SCX) — sched_ext is a framework that landed in mainline starting with kernel 6.12, letting you load custom scheduling policies via BPF without patching the kernel and without rebooting. On top of that, Gthulhu provides tiered scheduling on a per-policy basis: you can use regexes to target specific processes (for example irq/*-nvidia, vLLM’s EngineCore, or stress-ng) and assign priorities and time slices (execution time), carving the system’s work into tiers like “RT critical → GPU workload → infrastructure → background noise.”
In other words, Gthulhu lets us tell the kernel explicitly: “GPU interrupts and the inference engine come first; the stress tool comes dead last.” The experiment that follows is about verifying whether, under CPU pressure, this tiered scheduling can win back the 50% of throughput that vLLM lost.
Experiment Environment
- Hardware: NVIDIA DGX Spark (GB10) / ASUS Ascent GX10
- Kernel: Linux 6.17
- LLM Service:
- vLLM
- MicroK8s
- Model: Qwen/Qwen2.5-0.5B-Instruct
Prerequisites
Before playing with Gthulhu, we first need to get vLLM running on the GPU on GB10.
Note
If, like me, you’re using MicroK8s, do not install the NVIDIA GPU Operator. Its
nvidia-container-toolkit-daemonset uses nvidia-ctk runtime configure to modify MicroK8s’s containerd.toml, overwriting the whole config into containerd v3 format,
and on top of that it disables the CRI plugin. The result: the node goes NotReady and pods all get stuck in Terminating.
1. Install host-side NVIDIA components
A DGX Spark usually ships with the driver already installed. First verify that nvidia-smi can see the GB10:
nvidia-smi # should show GB10, driver, CUDA
Next, install nvidia-container-toolkit (be sure to use the arm64 stable repo):
curl -fsSL https://nvidia.github.io/libnvidia-container/gpgkey \
  | sudo gpg --dearmor -o /usr/share/keyrings/nvidia-container-toolkit-keyring.gpg

curl -s -L https://nvidia.github.io/libnvidia-container/stable/deb/nvidia-container-toolkit.list \
  | sed 's#deb https://#deb [signed-by=/usr/share/keyrings/nvidia-container-toolkit-keyring.gpg] https://#g' \
  | sudo tee /etc/apt/sources.list.d/nvidia-container-toolkit.list >/dev/null

sudo apt-get update
sudo apt-get install -y nvidia-container-toolkit
2. Install MicroK8s
sudo snap install microk8s --classic --channel=1.31/stable
sudo usermod -a -G microk8s "$USER"
newgrp microk8s
microk8s status --wait-ready
3. Register the nvidia runtime into MicroK8s’s containerd
There’s a key point here: what you modify is the template (containerd-template.toml), not
containerd.toml. MicroK8s re-renders the template into containerd.toml on every startup, so if you only edit
containerd.toml, it gets overwritten after microk8s stop; start or a snap refresh.
sudo nvidia-ctk runtime configure \
  --runtime=containerd \
  --config=/var/snap/microk8s/current/args/containerd-template.toml \
  --set-as-default=false

sudo microk8s stop
sudo microk8s start
microk8s status --wait-ready
Note
The runtime handler name that nvidia-ctk registers is nvidia-container-runtime
(not nvidia). The handler in your RuntimeClass later must match this exact name, otherwise pods will get stuck at RunPodSandbox failed ... no runtime for "nvidia".
4. Deploy the RuntimeClass and NVIDIA device plugin
# runtimeclass-nvidia.yaml
apiVersion: node.k8s.io/v1
kind: RuntimeClass
metadata:
  name: nvidia
handler: nvidia-container-runtime
---
# nvidia-device-plugin.yaml
# Copyright (c) 2019, NVIDIA CORPORATION.  All rights reserved.
#
# Licensed under the Apache License, Version 2.0 (the "License");
# you may not use this file except in compliance with the License.
# You may obtain a copy of the License at
#
#     http://www.apache.org/licenses/LICENSE-2.0
#
# Unless required by applicable law or agreed to in writing, software
# distributed under the License is distributed on an "AS IS" BASIS,
# WITHOUT WARRANTIES OR CONDITIONS OF ANY KIND, either express or implied.
# See the License for the specific language governing permissions and
# limitations under the License.

apiVersion: apps/v1
kind: DaemonSet
metadata:
  name: nvidia-device-plugin-daemonset
  namespace: kube-system
spec:
  selector:
    matchLabels:
      name: nvidia-device-plugin-ds
  updateStrategy:
    type: RollingUpdate
  template:
    metadata:
      labels:
        name: nvidia-device-plugin-ds
    spec:
      runtimeClassName: nvidia
      tolerations:
      - key: nvidia.com/gpu
        operator: Exists
        effect: NoSchedule
      # Mark this pod as a critical add-on; when enabled, the critical add-on
      # scheduler reserves resources for critical add-on pods so that they can
      # be rescheduled after a failure.
      # See https://kubernetes.io/docs/tasks/administer-cluster/guaranteed-scheduling-critical-addon-pods/
      priorityClassName: "system-node-critical"
      containers:
      - image: nvcr.io/nvidia/k8s-device-plugin:v0.19.3
        name: nvidia-device-plugin-ctr
        env: []
        securityContext:
          allowPrivilegeEscalation: false
          capabilities:
            drop: ["ALL"]
        volumeMounts:
        - name: kubelet-device-plugins-dir
          mountPath: /var/lib/kubelet/device-plugins
      volumes:
      - name: kubelet-device-plugins-dir
        hostPath:
          path: /var/lib/kubelet/device-plugins
          type: Directory
---
# test.yaml
apiVersion: v1
kind: Pod
metadata:
  name: cuda-vector-add
spec:
  restartPolicy: OnFailure
  runtimeClassName: nvidia
  containers:
    - name: cuda-vector-add
      image: "nvcr.io/nvidia/k8s/cuda-sample:vectoradd-cuda12.5.0-ubuntu22.04"
      resources:
        limits:
          nvidia.com/gpu: 1
Key points for the three YAMLs (runtimeclass-nvidia.yaml, nvidia-device-plugin.yaml, test.yaml):
- The RuntimeClass
handlermatches thenvidia-container-runtimeabove. - The device plugin uses
nvcr.io/nvidia/k8s-device-plugin:v0.19.3(multi-arch, includes arm64), and the pod spec must addruntimeClassName: nvidia, otherwise NVML inside the container can’t find the GPU device and it will CrashLoop. - On arm64 you cannot use the old
k8s.gcr.io/cuda-vector-add:v0.1test image (amd64-only); switch to one with an arm64 manifest:nvcr.io/nvidia/k8s/cuda-sample:vectoradd-cuda12.5.0-ubuntu22.04.
microk8s enable storage
microk8s kubectl apply -f runtimeclass-nvidia.yaml
microk8s kubectl apply -f nvidia-device-plugin.yaml
microk8s kubectl -n kube-system rollout status ds/nvidia-device-plugin-daemonset --timeout=3m

# Confirm the node starts advertising GPU capacity (should return 1)
microk8s kubectl get node -o jsonpath='{.items[0].status.capacity.nvidia\.com/gpu}'
Run a vectorAdd smoke test to confirm the GPU actually works:
microk8s kubectl apply -f test.yaml
microk8s kubectl wait --for=condition=Ready pod/cuda-vector-add --timeout=60s || true
microk8s kubectl logs cuda-vector-add   # seeing Test PASSED means it works
5. Deploy vLLM (Qwen2.5-0.5B-Instruct)
Finally, bring up vLLM as an OpenAI-compatible server. The bundle includes a PVC (HuggingFace cache), a Secret (HF token), a Deployment, and a Service.
# token.yaml
apiVersion: v1
kind: PersistentVolumeClaim
metadata:
  name: vllm-models
spec:
  storageClassName: microk8s-hostpath
  accessModes:
    - ReadWriteOnce
  volumeMode: Filesystem
  resources:
    requests:
      storage: 50Gi
---
apiVersion: v1
kind: Secret
metadata:
  name: hf-token-secret
type: Opaque
stringData:
  token: <YOUR_HF_TOKEN>
---
# deployment.yaml
apiVersion: apps/v1
kind: Deployment
metadata:
  name: vllm-server
  labels:
    app.kubernetes.io/name: vllm
spec:
  replicas: 1
  strategy:
    type: Recreate                 # PVC is RWO; avoid two pods fighting for it during rollout
  selector:
    matchLabels:
      app.kubernetes.io/name: vllm
  template:
    metadata:
      labels:
        app.kubernetes.io/name: vllm
    spec:
      runtimeClassName: nvidia     # matches RuntimeClass `nvidia` → handler `nvidia-container-runtime`
      terminationGracePeriodSeconds: 30
      containers:
      - name: vllm
        # NOTE (gx10 / GB10 Blackwell / arm64):
        #   `vllm/vllm-openai:latest` currently publishes an arm64 multi-arch
        #   image built against CUDA 12.8 + PyTorch 2.6 which supports Blackwell
        #   (sm_121). If a specific tag misses arm64 or Blackwell kernels, fall
        #   back to NVIDIA's NGC PyTorch container and `pip install vllm` in it,
        #   e.g. base: nvcr.io/nvidia/pytorch:25.06-py3
        image: vllm/vllm-openai:latest
        imagePullPolicy: IfNotPresent
        args:
          - --model
          - Qwen/Qwen2.5-0.5B-Instruct
          - --dtype
          - auto                    # picks bf16 on Blackwell
          - --max-model-len
          - "1024"
          # NOTE (GB10 unified memory):
          #   On Grace-Blackwell, CUDA reports total system RAM as GPU memory
          #   (~121 GiB here). --gpu-memory-utilization is a *fraction of that
          #   reported total*, so 0.90 would try to reserve ~109 GiB and crash
          #   with "Free memory on device cuda:0 (X/121 GiB) ... less than
          #   desired GPU memory utilization (0.9, 109 GiB)".
          #   Keep this small; Qwen2.5-0.5B needs only ~1-2 GiB weights + KV.
          - --gpu-memory-utilization
          - "0.10"
          - --tensor-parallel-size
          - "1"
          - --enforce-eager         # skip CUDA graph capture -> less peak memory + faster startup
          - --no-enable-prefix-caching  # disable server-side KV prefix caching so benchmarks measure real prefill each run
          - --host
          - "0.0.0.0"
          - --port
          - "8000"
        env:
        - name: HF_TOKEN
          valueFrom:
            secretKeyRef:
              name: hf-token-secret
              key: token
        - name: HF_HUB_ENABLE_HF_TRANSFER
          value: "1"                # faster model download
        - name: VLLM_LOGGING_LEVEL
          value: INFO               # DEBUG is very noisy; flip if you need it
        # NOTE: NVIDIA_VISIBLE_DEVICES / NVIDIA_DRIVER_CAPABILITIES are injected
        # by the k8s device plugin + nvidia-container-runtime based on the
        # `nvidia.com/gpu` request below, so we do NOT hard-code them here.
        # Setting them manually can override the device plugin's allocation.
        resources:
          requests:
            cpu: "2"
            memory: "8Gi"
            nvidia.com/gpu: 1
          limits:
            cpu: "8"
            memory: "24Gi"
            nvidia.com/gpu: 1
        ports:
          - name: http
            containerPort: 8000
        readinessProbe:
          httpGet:
            path: /health
            port: http
          initialDelaySeconds: 60
          periodSeconds: 10
          failureThreshold: 30      # model load + warmup can be slow
        livenessProbe:
          httpGet:
            path: /health
            port: http
          initialDelaySeconds: 300
          periodSeconds: 30
          failureThreshold: 5
        volumeMounts:
          - name: hf-cache
            mountPath: /root/.cache/huggingface
          - name: dshm
            mountPath: /dev/shm     # vLLM/NCCL/PyTorch require large /dev/shm; default 64Mi is not enough
      volumes:
      - name: hf-cache
        persistentVolumeClaim:
          claimName: vllm-models
      - name: dshm
        emptyDir:
          medium: Memory
          sizeLimit: 8Gi
---
apiVersion: v1
kind: Service
metadata:
  name: vllm-server
  labels:
    app.kubernetes.io/name: vllm
spec:
  selector:
    app.kubernetes.io/name: vllm
  ports:
  - name: http
    protocol: TCP
    port: 8000
    targetPort: http
  type: ClusterIP
- Replace
with your own HuggingFace token; vLLM uses it to download the model.
There are a few gx10-specific gotchas:
| Field | Value | Why |
|---|---|---|
runtimeClassName |
nvidia |
Matches the RuntimeClass, otherwise no GPU access |
strategy.type |
Recreate |
The PVC is RWO; a rolling update would have two pods fighting for the volume |
--gpu-memory-utilization |
0.10 |
GB10 unified-memory trap, see below |
--enforce-eager |
true | Skips CUDA graph capture, saving peak memory and speeding up startup |
/dev/shm volume |
emptyDir medium=Memory, 8Gi |
The default 64Mi shm causes Bus error |
Note
GB10 unified-memory trap: Grace-Blackwell uses a unified memory architecture. The CUDA driver reports the entire system RAM (~121 GiB) as GPU memory, so --gpu-memory-utilization is “a fraction of that 121 GiB,” not the VRAM of a traditional discrete GPU. Setting 0.9 as in the official example will CrashLoop outright due to insufficient free memory. For a small model like Qwen2.5-0.5B, 0.10 (≈12 GiB) is more than enough.
Seeing Application startup complete. means the API is up. Fire a request via port-forward to
confirm:
microk8s kubectl port-forward svc/vllm-server 8000:8000
curl -sS http://localhost:8000/v1/models
At this point, a vLLM service running on the GB10 GPU is ready, and we can start the Gthulhu scheduling-optimization experiment.
6. Install Gthulhu
See: https://gthulhu.org/k8s/ Before installing, we recommend changing the “develop” tag in values.yaml to “main” (or whatever release tag you want) to avoid installing a development build.
For this experiment you’ll need v1.3.0 or newer. Starting with that version, Gthulhu supports Node Level Policy, which lets us change the scheduling policy of all processes on the host — this is crucial for a workload like vLLM that needs to protect GPU IRQs.
7. Tune the scheduling policies
First, let’s create a few Node Level Policies, each assigning a different priority to a different process. Here are the policies we used in the experiment:
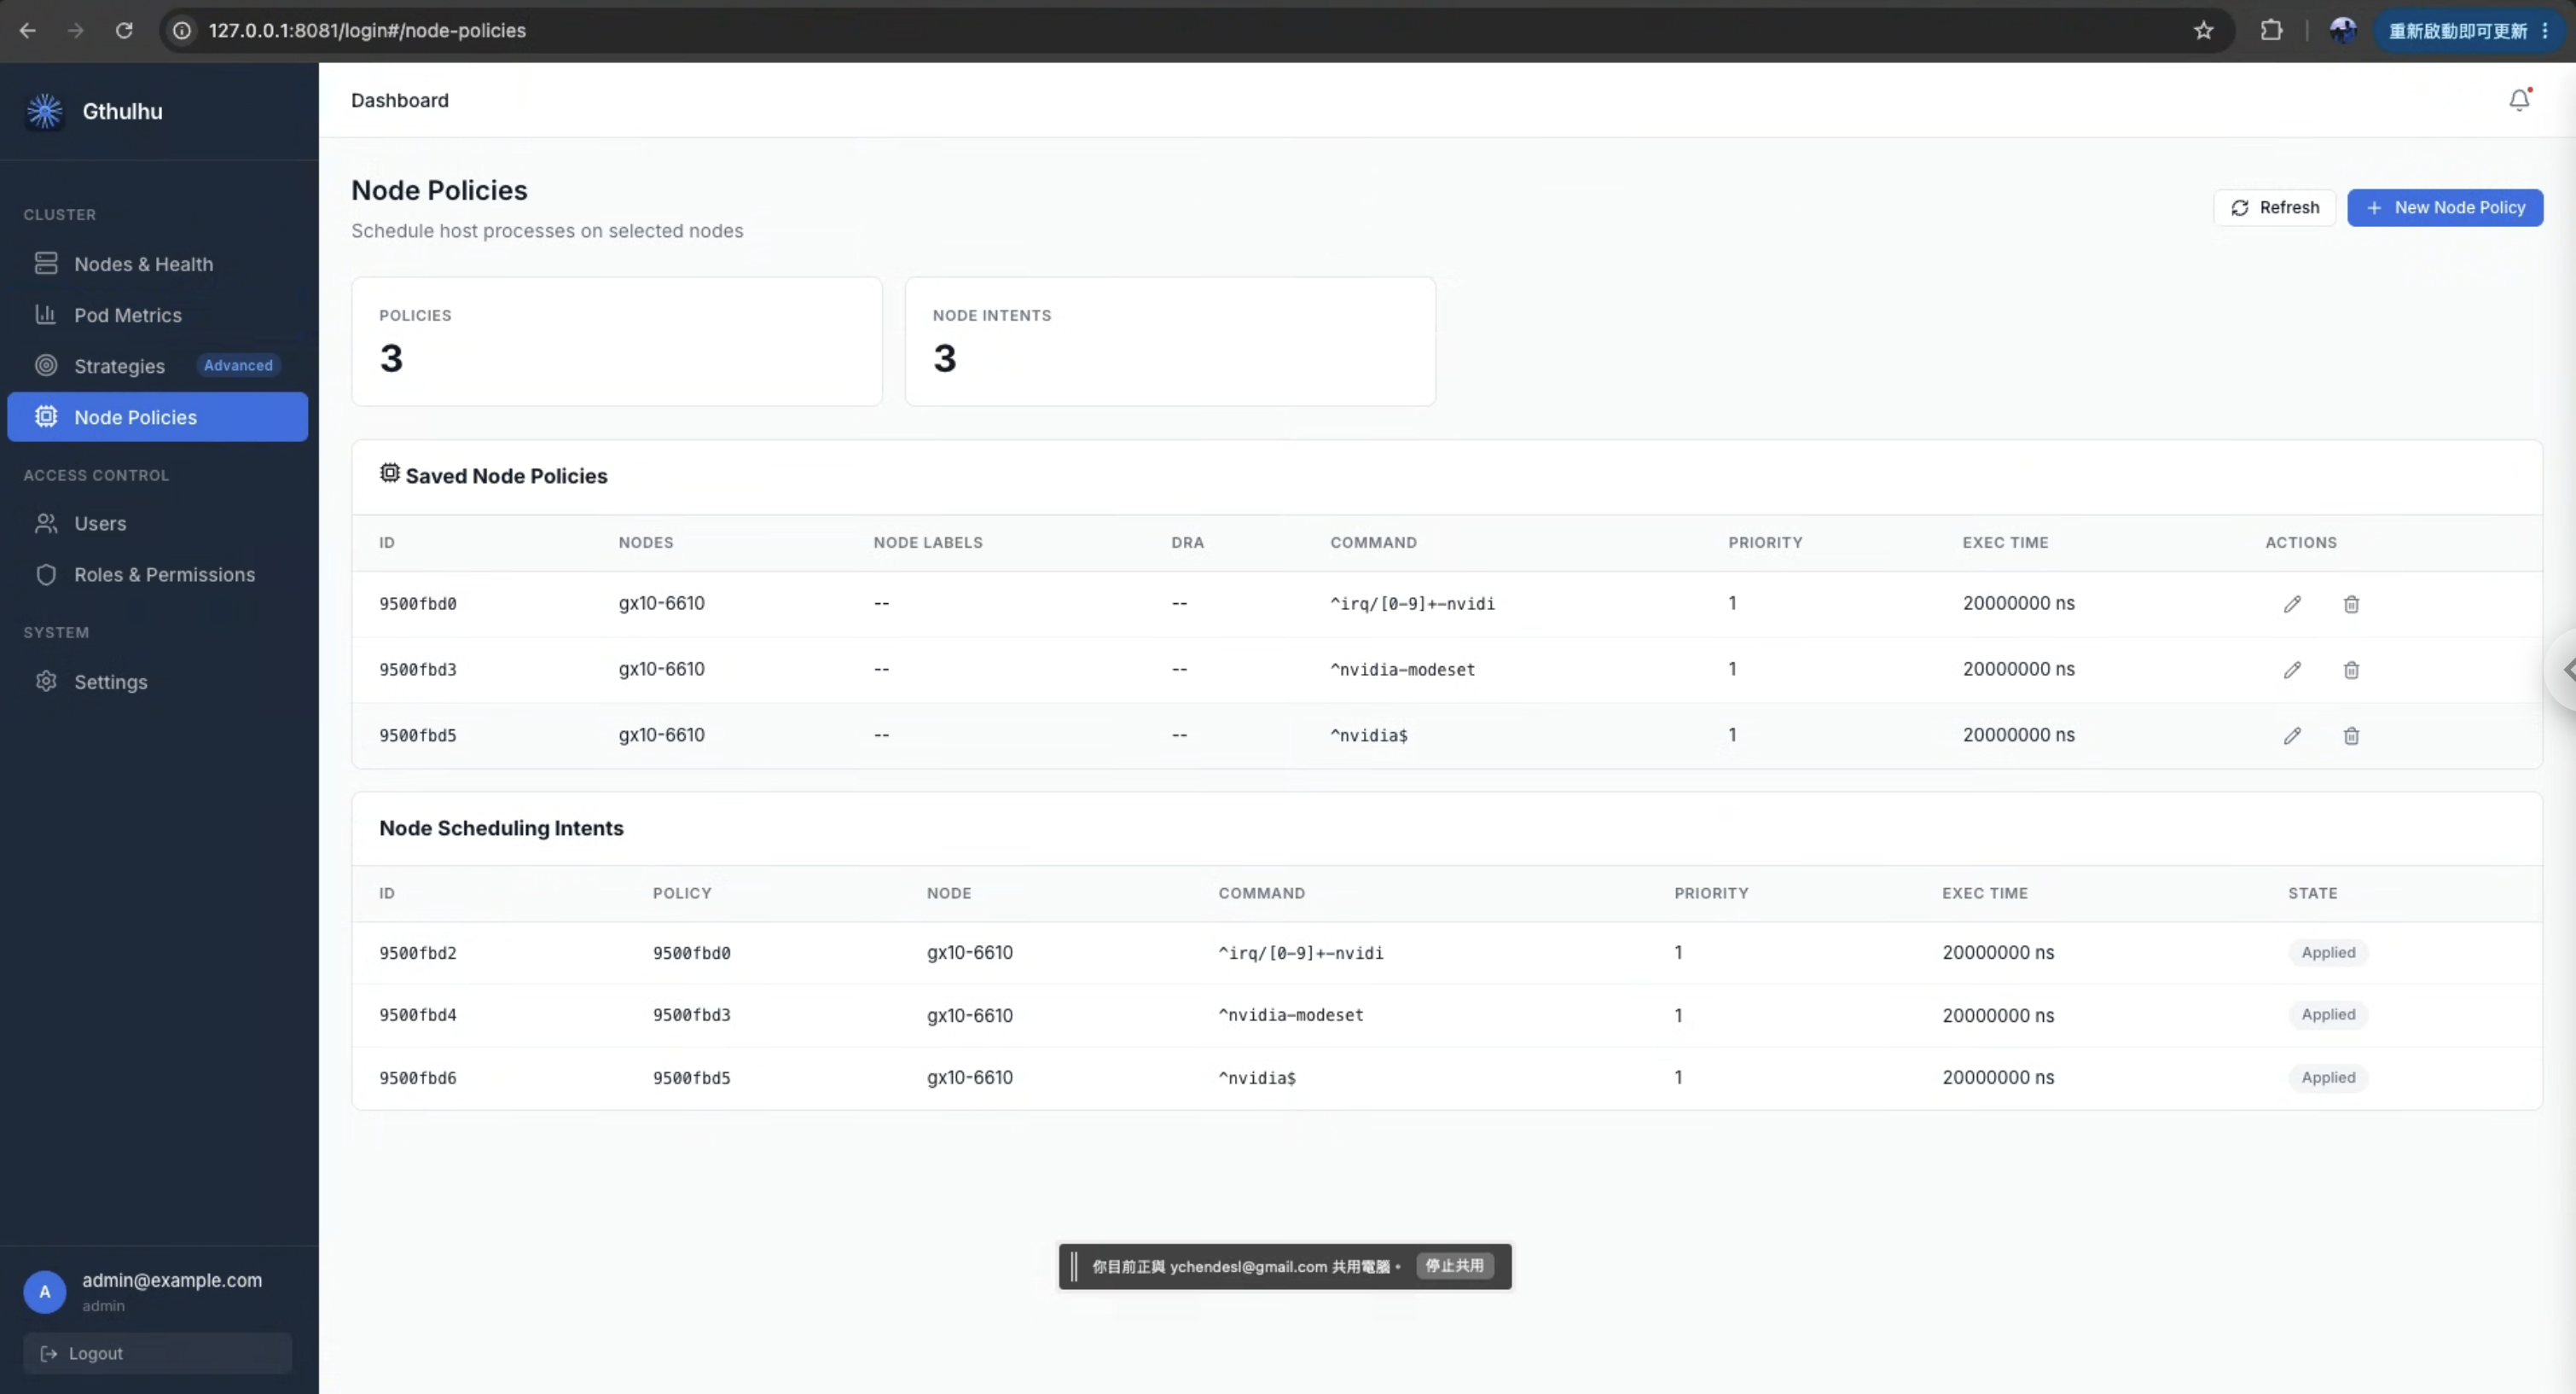
nvidia-modeset/*nvidiairq/*-nvidia
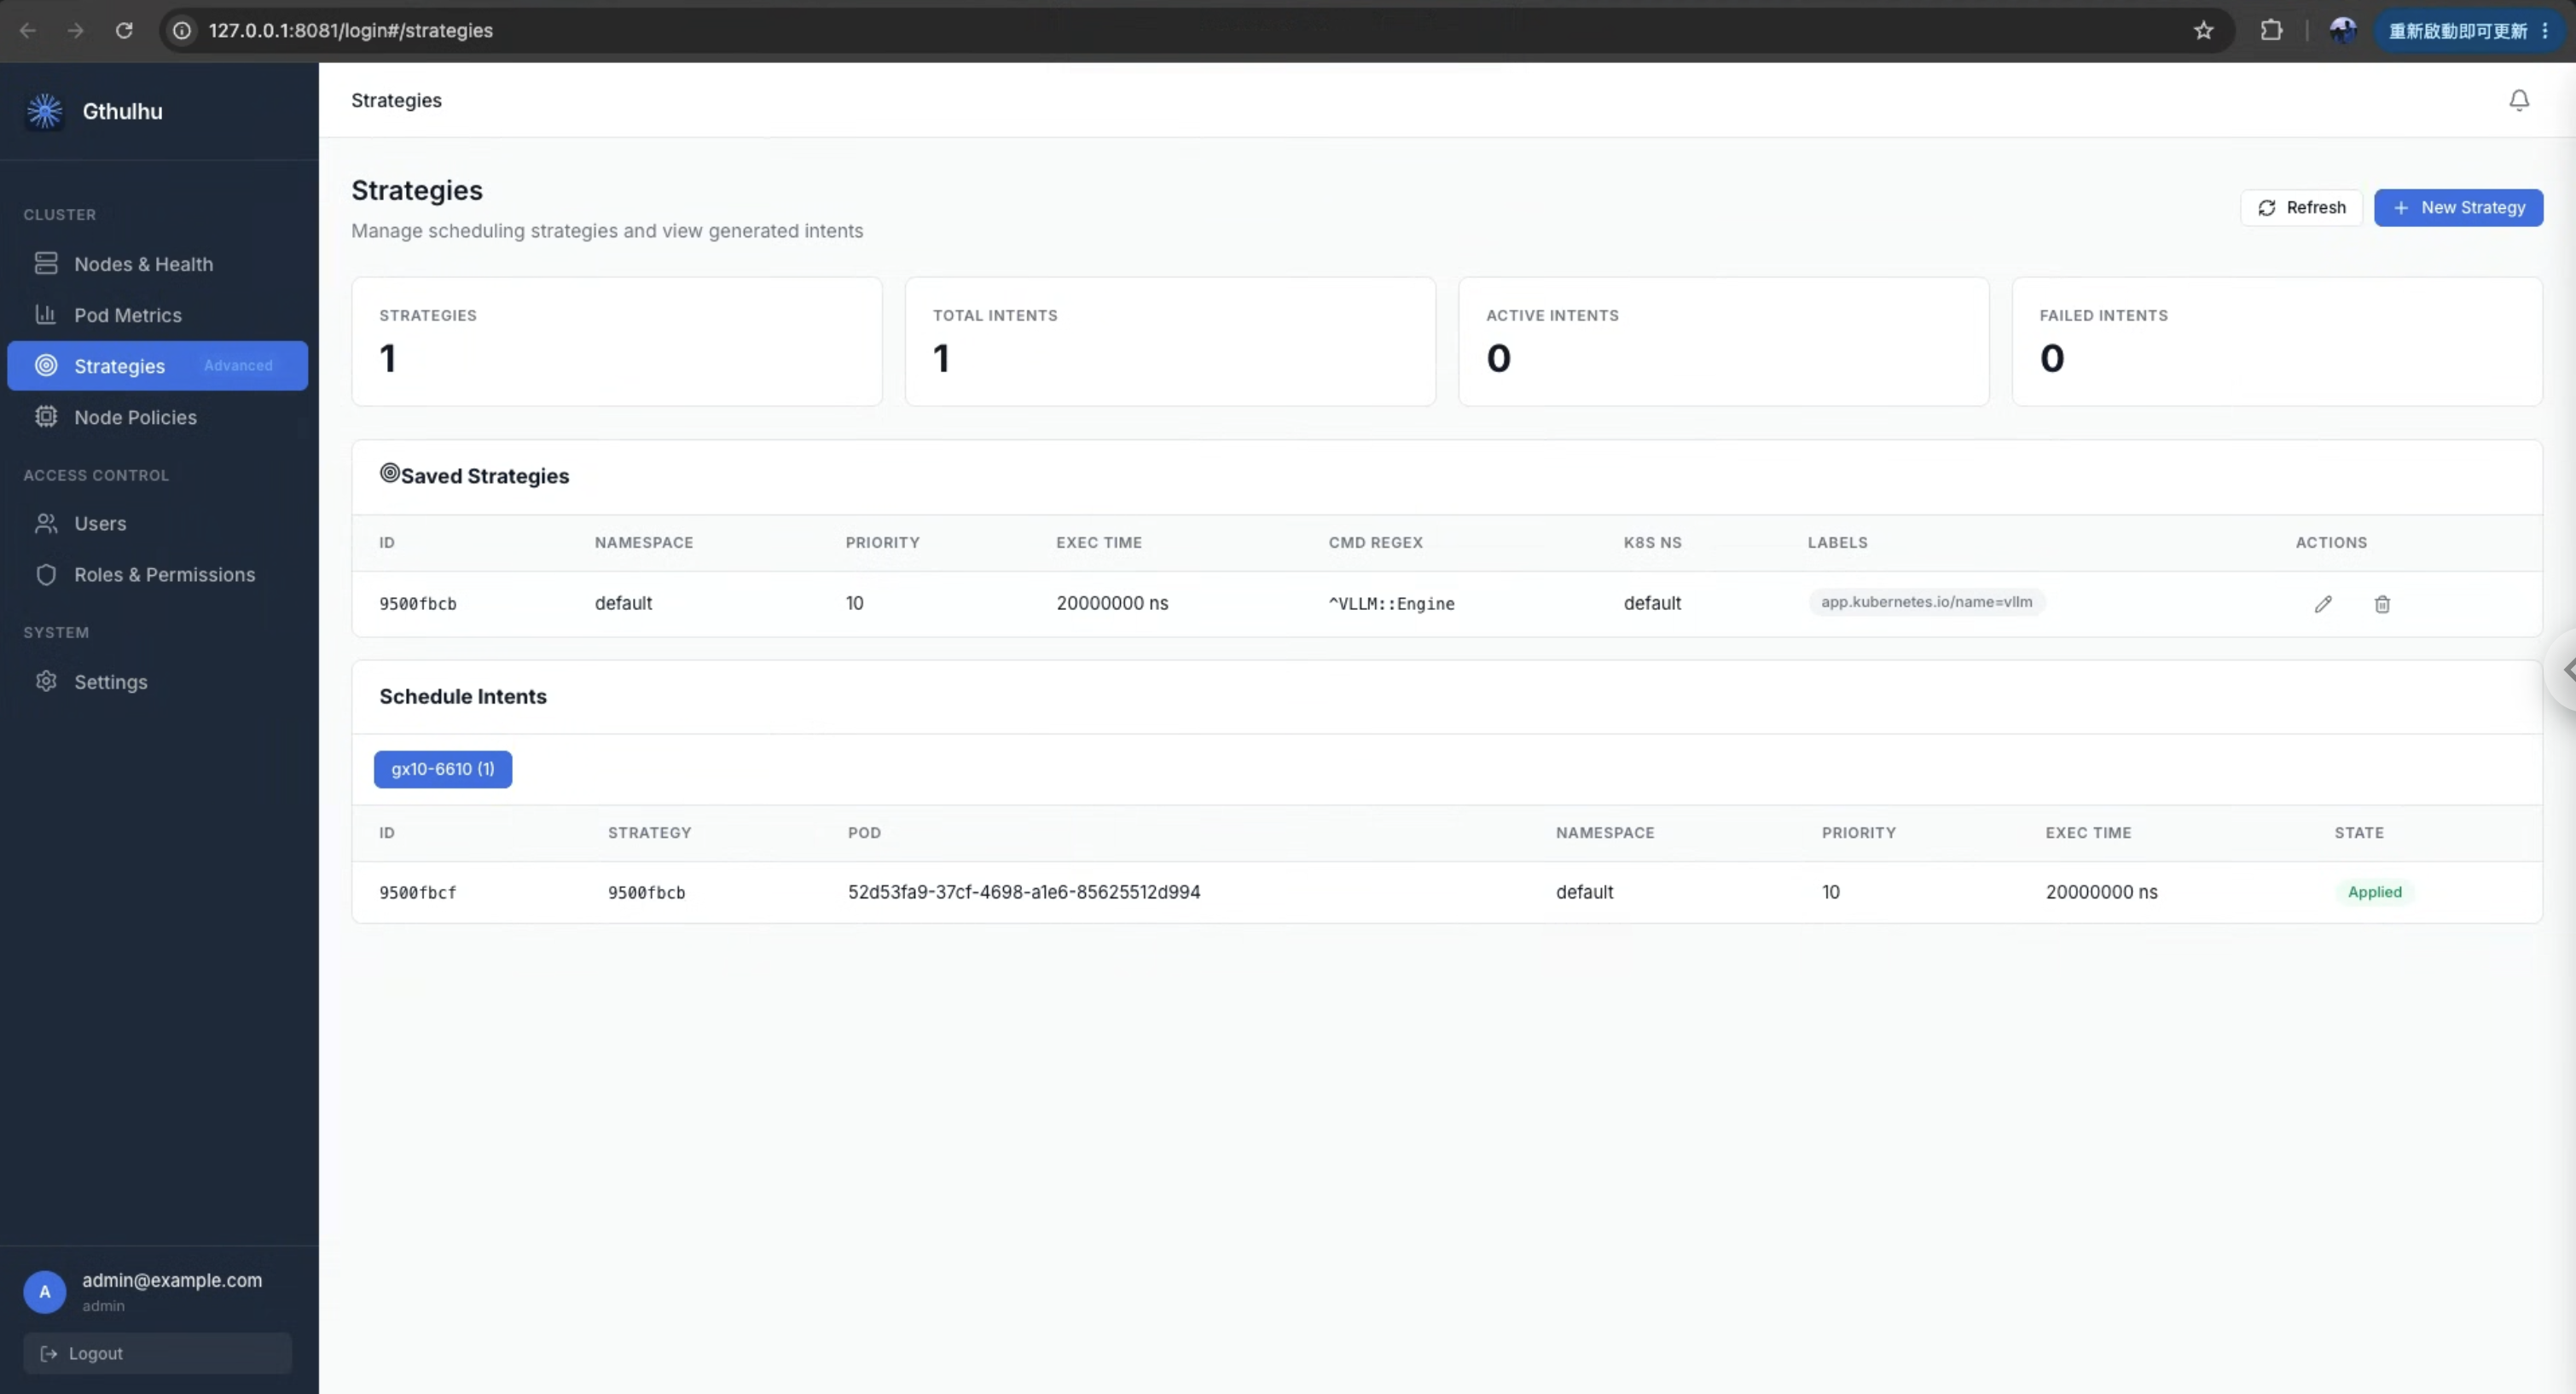
- vLLM’s
EngineCorethread
Note
Before applying the policies, we confirmed that vLLM’s EngineCore thread is named vllm:EngineCore. This name may change as vLLM versions update, so please verify the thread name in your own experiment first.
You can also use the Pod Metrics tab to verify whether vllm:EngineCore is indeed an interactive thread, so that you can effectively protect it under CPU pressure.
8. Results
For this experiment, we used stress-ng to simulate CPU pressure and llama-benchy to measure vLLM’s throughput. The three scenarios are:
- A. Baseline: under CPU pressure, running the Linux default scheduler (EEVDF), no Gthulhu.
- B. Gthulhu (no policy): swap the scheduler to Gthulhu but apply no policy at all, to isolate the effect of the scheduler itself.
- C. Gthulhu + Policy: on top of B, apply the tiered scheduling policies from Section 7 (GPU IRQ / driver raised to the highest tier, vLLM
EngineCoremarked as interactive, everything else deprioritized).
Here pp* (prefill) is the throughput of feeding the whole prompt in at once, tg* (decode / token generation) is the throughput of generating tokens one by one and is also the metric that best reflects whether the GPU inference hot path is protected; ttfr / e2e_ttft are the latency to the first token.
A. Baseline (no Gthulhu, under CPU pressure)
| model | test | t/s | peak t/s | ttfr (ms) | est_ppt (ms) | e2e_ttft (ms) |
|---|---|---|---|---|---|---|
| Qwen2.5-0.5B | pp128 | 6066.73 ± 9059.47 | 253.36 ± 149.02 | 192.57 ± 149.02 | 253.36 ± 149.02 | |
| Qwen2.5-0.5B | tg64 | 7.39 ± 2.00 | 14.30 ± 9.79 | |||
| Qwen2.5-0.5B | tg128 | 7.20 ± 1.34 | 20.80 ± 14.65 | |||
| Qwen2.5-0.5B | pp256 | 2420.16 ± 4980.19 | 368.13 ± 103.26 | 307.35 ± 103.26 | 368.13 ± 103.26 | |
| Qwen2.5-0.5B | tg64 | 6.37 ± 0.81 | 9.70 ± 4.84 | |||
| Qwen2.5-0.5B | tg128 | 6.44 ± 0.72 | 14.10 ± 10.72 | |||
| Qwen2.5-0.5B | pp512 | 1580.57 ± 62.92 | 385.09 ± 12.68 | 324.31 ± 12.68 | 385.09 ± 12.68 | |
| Qwen2.5-0.5B | tg64 | 6.16 ± 0.33 | 8.20 ± 2.23 | |||
| Qwen2.5-0.5B | tg128 | 6.39 ± 0.64 | 13.90 ± 10.22 |
decode is stuck around 6–7 t/s, with TTFT as high as 250–390 ms — this is what it looks like when the CPU is saturated by stress-ng and vLLM’s hot path can’t get the CPU.
B. Gthulhu (scheduler swapped, no policy)
| model | test | t/s | peak t/s | ttfr (ms) | est_ppt (ms) | e2e_ttft (ms) |
|---|---|---|---|---|---|---|
| Qwen2.5-0.5B | pp128 | 16853.04 ± 22651.21 | 95.29 ± 95.05 | 45.32 ± 94.47 | 95.29 ± 95.05 | |
| Qwen2.5-0.5B | tg64 | 19.57 ± 3.76 | 27.70 ± 6.54 | |||
| Qwen2.5-0.5B | tg128 | 17.34 ± 3.38 | 28.42 ± 7.77 | |||
| Qwen2.5-0.5B | pp256 | 31951.35 ± 45929.49 | 142.15 ± 133.51 | 92.41 ± 132.51 | 142.15 ± 133.51 | |
| Qwen2.5-0.5B | tg64 | 20.53 ± 2.98 | 27.90 ± 6.82 | |||
| Qwen2.5-0.5B | tg128 | 17.50 ± 2.69 | 29.50 ± 4.88 | |||
| Qwen2.5-0.5B | pp512 | 24737.77 ± 22759.95 | 140.91 ± 103.17 | 89.77 ± 103.17 | 140.91 ± 103.17 | |
| Qwen2.5-0.5B | tg64 | 17.86 ± 3.97 | 25.55 ± 5.59 | |||
| Qwen2.5-0.5B | tg128 | 17.56 ± 3.07 | 31.00 ± 7.35 |
decode jumps straight to 17–20 t/s, and TTFT drops to 95–175 ms. Note that not a single policy has been applied yet.
C. Gthulhu + Policy (tiered scheduling policies)
| model | test | t/s | peak t/s | ttfr (ms) | est_ppt (ms) | e2e_ttft (ms) |
|---|---|---|---|---|---|---|
| Qwen2.5-0.5B | pp128 | 9892.80 ± 18487.97 | 187.25 ± 126.13 | 145.69 ± 126.13 | 187.25 ± 126.13 | |
| Qwen2.5-0.5B | tg64 | 17.03 ± 4.30 | 25.40 ± 7.34 | |||
| Qwen2.5-0.5B | tg128 | 22.96 ± 7.02 | 34.17 ± 6.54 | |||
| Qwen2.5-0.5B | pp256 | 7899.74 ± 8421.16 | 162.23 ± 116.04 | 120.67 ± 116.04 | 162.23 ± 116.04 | |
| Qwen2.5-0.5B | tg64 | 15.62 ± 3.58 | 24.75 ± 7.14 | |||
| Qwen2.5-0.5B | tg128 | 22.28 ± 6.09 | 33.26 ± 8.26 | |||
| Qwen2.5-0.5B | pp512 | 19734.13 ± 16280.40 | 158.73 ± 132.23 | 117.17 ± 132.23 | 158.73 ± 132.23 | |
| Qwen2.5-0.5B | tg64 | 20.69 ± 5.96 | 28.80 ± 7.88 | |||
| Qwen2.5-0.5B | tg128 | 18.69 ± 3.20 | 29.40 ± 7.07 |
Overall comparison (decode-focused)
| Scenario | decode tg64 (t/s) | decode tg128 (t/s) | peak decode (t/s) | e2e_ttft (ms) |
|---|---|---|---|---|
| A. Baseline | ~6.6 | ~6.7 | ~13.5 | ~336 |
| B. Gthulhu (no policy) | ~19.3 | ~17.5 | ~28.3 | ~126 |
| C. Gthulhu + Policy | ~17.8 | ~21.3 | ~29.3 | ~169 |
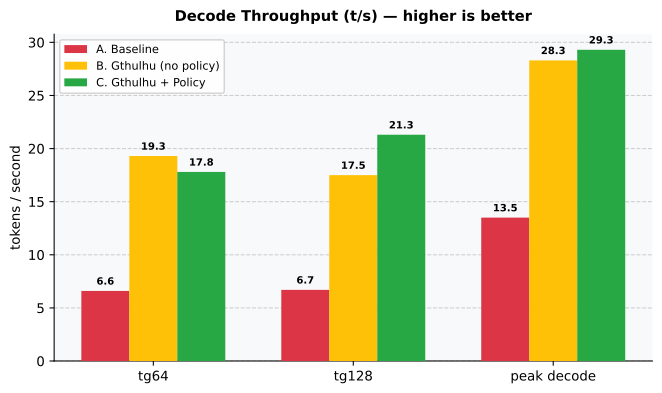
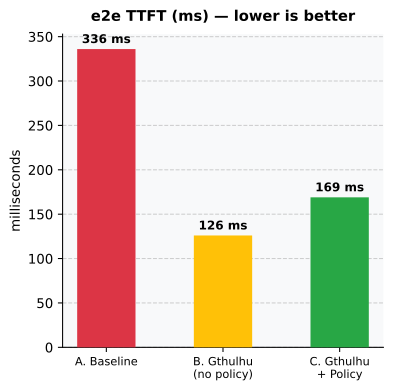
Just swapping the scheduler to Gthulhu (A → B) lifts decode throughput from ~6.6 t/s to ~18 t/s —
nearly 3× — and cuts TTFT from ~336 ms to ~126 ms (more than halved); adding the tiered policy on top (B → C) pushes the longer
tg128 decode further from ~17.5 t/s to ~21.3 t/s (+22%), with peak decode also edging up slightly. TTFT in scenario C rises to ~169 ms compared to B, because the tiered policy gives more CPU to decode at the expense of the front-end path (uvicorn, tokenizer) — a trade-off explained in the analysis below.
Why does “just swapping the scheduler” have such a big effect?
This seems counterintuitive at first — with no policy applied at all, merely switching from EEVDF to Gthulhu makes decode nearly 3× faster. The reason is that Gthulhu’s scheduling core is derived from scx_bpfland, and
scx_bpfland is inherently designed for interactive workloads.
Its core idea is: a task that frequently yields the CPU voluntarily (voluntary context switch) and is often woken up gets classified as interactive and receives higher scheduling priority. This maps perfectly onto vLLM decode’s behavior — after each decode step, EngineCore submits a batch of CUDA kernels, then yields the CPU to wait for GPU completion, and after being woken by the GPU interrupt it runs the next step. This “run a bit, sleep a bit, get woken, run again” is a textbook interactive pattern.
By contrast, a pure-compute workload like stress-ng --cpu hogs the CPU continuously (CPU-bound, almost never yielding voluntarily), so in scx_bpfland’s eyes it’s batch/background in nature and its priority is naturally suppressed. So even with no policy applied, Gthulhu has already automatically pulled vLLM’s hot path out of the stress flood — that’s the source of B’s gain over A.
After applying the policy, why does “only decode go up while everything else drops”?
From B → C we see an interesting phenomenon: after applying the tiered policy, decode (especially tg128) rises noticeably, but prefill-related metrics (est_ppt, prefill t/s) not only fail to improve but even regress slightly. This actually confirms the scope of the policy’s effect.
The focus of this policy set is to raise the GPU IRQ / driver kthreads to the highest tier and to protect vLLM’s EngineCore by marking it interactive. And decode is the purest, most GPU-inference-heavy stage of the whole pipeline — it’s essentially the loop “EngineCore submits kernel → GPU computes → IRQ notifies → EngineCore receives completion” repeating over and over. What we protected is precisely every link on this loop, so decode reaps the most direct, most visible benefit.
But the other metrics (TTFT, prefill throughput) are not a pure GPU loop; they also involve an entire data-passing path:
benchmark client → HTTP → vLLM API server(uvicorn) → tokenize → scheduler → EngineCore
Every segment on this path — the benchmark client itself, HTTP/socket I/O, the uvicorn worker, the tokenizer — still runs at default priority and isn’t specifically protected by this policy set. In other words, we only boosted the GPU inference segment, without tuning the front-end path “from request arrival to EngineCore” at all, so under CPU pressure these metrics still get diluted by background work, and may even drop slightly because CPU time was reallocated to decode.
This also points to the direction for further fine-tuning: every segment of the path needs its own policy. For example, adding appropriate interactive / priority policies to the uvicorn API server thread, the tokenizer, and even the benchmark client would lift TTFT and prefill together. This experiment first proves that “tiered scheduling can win back the most core metric, decode”; the end-to-end optimization of the remaining path is left for the next round of segment-by-segment tuning.
Conclusion
Back to the original question: when vLLM is thrown into production and fights a bunch of noisy neighbors for the same set of CPUs, no matter how fast the GPU is, it can’t save the throughput being dragged down. What this experiment wants to prove is — this is actually a scheduling problem, not a hardware problem.
On the DGX Spark (GB10), we saturated the CPU with stress-ng, reproduced the misery of decode throughput collapsing from the warm baseline down to 6–7 t/s, and then won it back in two stages. A few points worth pondering from this article:
- CPU scheduling is an underrated knob in LLM serving. Without adding a GPU, changing the model, or touching any vLLM parameter, scheduling alone can substantially win back the throughput eaten by a noisy neighbor.
sched_extmakes this low-risk. No kernel patching, no reboot — dynamically loaded via BPF and detachable anytime if something breaks, it’s well suited for experimenting on real nodes.- Tiered policies must target the hot path. The biggest gains show up exactly where you explicitly protect; to lift end-to-end (TTFT, prefill) together, you have to add corresponding policies segment by segment for uvicorn, the tokenizer, and even the client — which is what we’ll do in the next round.
If you also have a GPU node stuffed with all kinds of background work, try swapping the scheduler to Gthulhu — you might win back that eaten half of the performance without adding a single card.